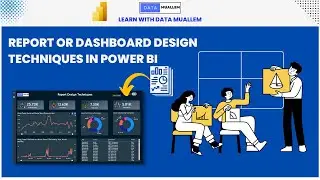
Power BI Dashboard or Report Design Techniques - Part 2
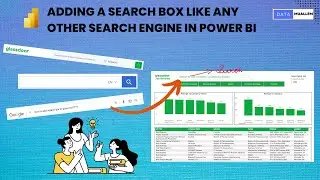
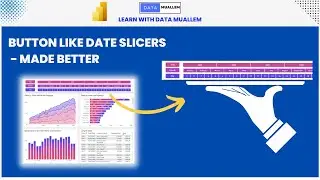
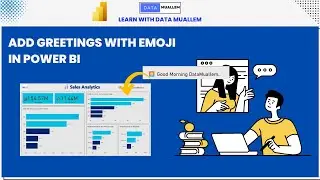
In this video, we will see a few best practices which are very useful for a report or a dashboard design such as Gradient Colors, Labelling and formatting, Sync Slicers and many more.
For Color codes, use https://imagecolorpicker.com/
For Icons, use https://www.flaticon.com/
For Emojis, use https://unicode-table.com/en/ or https://emojipedia.org/ or https://getemoji.com/
Timelines
0:00 Intro
0:41 Gradient Colors
2:31 Top N Filter
4:03 Labelling and Formatting
5:49 Interactive Visuals
6:27 Sync Slicers
Visit https://www.datamuallem.com for more tips and tutorials.
👉 Please subscribe to my channel for more videos 💡
💜 Let me know in the comments which topic you would like to see a video on next.
Thanks for being a part of this channel and for all your support! 🔥🔥
#PowerBI #DataMuallem #DataTraining
#powerbidesktop #powerbitraining #powerbideveloper #DAX #dashboarddesign #design #reportdesign #powerbidesign