19 тысяч подписчиков
2 тысяч видео
Chart JS Background Color Chart JS 4
How to Add Space Between Start and End of X Scale in Chart JS
Chart Animation Delay Chart JS 3 | ChartJS 3
2 Background Color Array | Chart JS Background Color Series
How to Add Text and Value at the Center of a Doughnut Chart in Chart JS?
15 listeners options chartjs plugin datalabels chart js
How to Make Gradient Color on Vertical Hover Line in Chart JS 4
How to Create Line Chart with Equal Distant Time Scale in Chart js
Display No Data Available if No Data is Available in Chart JS 4
How to use Chartjs Dragdata Plugin [chartjs-plugin-dragdata] in chart js | Part 1
How to Overlap Bar on Top of Stacked Bar Chart in Chart JS
ParseFloat Method JavaScript
Grid lines Chart JS 3 | ChartJS 3
8 Scatter chart for streaming in Chart JS | Chartjs Plugin Streaming Series
Chart Animation Speed Chart JS 3 | ChartJS 3
13 Zoom Overscalemode Options Chartjs Plugin Zoom in Chart.js
How to Add Markers to Line Chart in Chart JS 4
How to Add if Statement Value in Vue JS
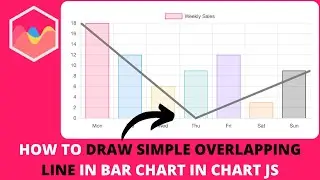
How to Draw Simple Overlapping Line in Bar Chart in Chart JS
How to Add More Information in the Tooltips in Chart JS
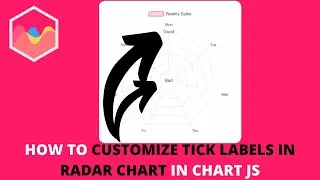
How to Customize Tick Labels in Radar Chart in Chart JS
How to Display Markers on Hover in Chart JS 4 Short
6. Line and Label Annotation Plugin chartjs-plugin-annotation in Chart.js
How to Add Labels Around the Radial Bar Chart in Chart JS 4
7. Multiple Shapes and Lines Annotation Plugin chartjs-plugin-annotation in Chart.js
4 Create a Bar Chart with Database Arrays | Chartjs Mysql Database Series
Solve Error: DevTools failed to Load Source Map in Chart JS 4
How to Make Background Color Range Dynamic With Changing X Scale in Chart JS
How to set Background Color for Specific chartArea Section in Chart JS
How To Rotate Custom Data Label For Stacked Bar Chart in Chart JS 4
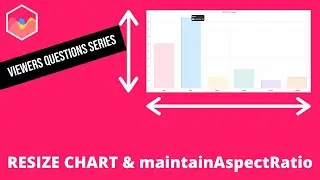
How to Resize the Chart and maintainAspectRatio in Chart JS
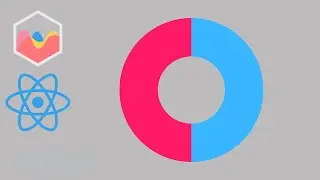
How to Create Doughnut Chart in React Chart JS 2
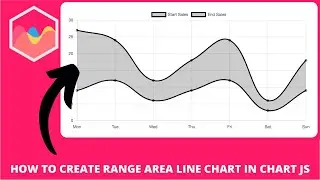
How to Create Range Area Line Chart in Chart js
Changing Mouse Cursor onDrag Chartjs Dragdata Plugin [chartjs-plugin-dragdata] in chart js | Part 2
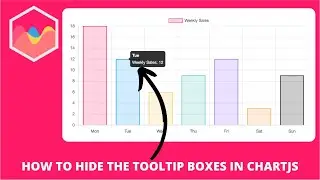
How to Hide the Tooltip Boxes in Chart.js
Adjust Color of Line in Crosshair Plugin [chartjs-plugin-crosshair] in Chart JS | Part 2
How to Create Custom Candlestick Chart In Chart JS Part 1
How to Show Arrays Organized in the Console.log Javascript
how to place multiple charts side by side in chart js
ChartJS reading the basic setup of charts 2018 [3/5]
Multiple Input Text JavaScript Input Type Series Part 3
7 Tailwind CSS Navigation Bar Navbar 1
How to Create Gauge Chart With Needle in Chart JS 4 Part 5
10 Zoom Wheel Modifierkey Options Chartjs Plugin Zoom in Chart.js
React Chart JS Stacked Bar Chart in Chart JS 4
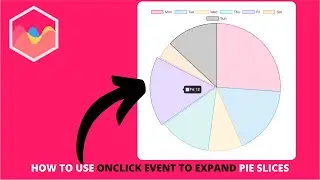
How to Use Onclick Event to Expand Pie Slices in Chart js
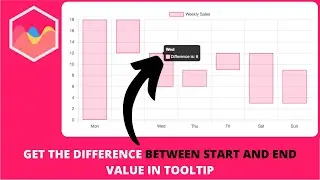
How to Calculate the Difference Between Start and End Value in Tooltip in Chart js
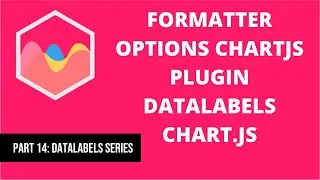
14 Formatter Options in Chartjs Plugin Datalabels in Chart.JS
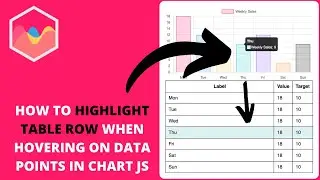
How to Highlight Table Row When Hovering on Data Points in Chart JS
9 How to create a Plugin in Chart JS | Chart JS Plugin Series
Show and Hide Datasets Dynamically with a Select All Checkbox in Chart.js


![How to use Chartjs Dragdata Plugin [chartjs-plugin-dragdata] in chart js | Part 1](https://images.videosashka.com/watch/2xrWh6CSdSE)


![Changing Mouse Cursor onDrag Chartjs Dragdata Plugin [chartjs-plugin-dragdata] in chart js | Part 2](https://images.videosashka.com/watch/Lt4xPOEZOFs)
![Adjust Color of Line in Crosshair Plugin [chartjs-plugin-crosshair] in Chart JS | Part 2](https://images.videosashka.com/watch/EhogAIJgWgU)

![ChartJS reading the basic setup of charts 2018 [3/5]](https://images.videosashka.com/watch/h2sCGFCS52w)