How to Display Markers on Hover in Chart JS 4 Short
How to Display Markers on Hover in Chart JS 4 Short
Full video: • How to Display Markers on Hover in Ch... (Available 17 Feb 2023)
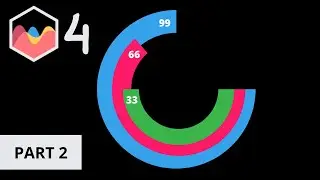
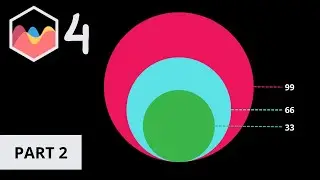
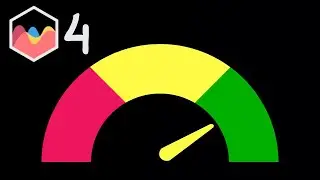
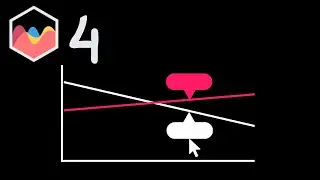
In this video we will explore how to display markers on hover in chart js 4. With Chart.js we can create markers but making them interactive is a quite complicated matter. To do this we will need to create plugin that separates the two parts.
We have one that understands the mouse interaction and triggers the redrawing and the second part that draws the shape. They must be seperated or else they will overlap each other.
Let's explore this.
▬ Materials/References ▬▬▬▬▬▬▬▬▬▬
Source Code: / chartjs
To keep the video short we might expect you to know parts. These parts we have explained in other videos. You can find the references here below:
Understand setup, config and render init blocks: • How to use config and setup in a line...
Starting Code: https://www.chartjs3.com/docs/chart/g...
Understanding Object Destructuring in Chart JS: • Understanding Object Destructuring in...
Understanding ChartArea in Chart JS: • Understanding chartArea in Chart js
▬ Got a Question? Comment! ▬▬▬▬▬▬▬▬▬▬
Got a question or special request about a specific item? Comment below and tell me your question. I will make sure to follow up on you!
▬ Find Me Here ▬▬▬▬▬▬▬▬▬▬
Blog: https://www.chartjs3.com/chart-js-blog/
Website: https://www.chartjs3.com
Udemy Course: https://www.udemy.com/course/chart-js...
Chart JS tutorials for Beginners:
🎓 Beginners Serie: • ChartJS intro creating a chart 2018 |...
Chart JS tutorials for Intermediate:
👁️ Most Watched Chart JS Video: • Update dynamic chart js | Chart.js Co...
⭐ Personal Favorite Chart JS Video: • How to make an interactive bar chart ...
Chart JS Dashboard Series:
👍 Most Liked Video Series:
Watch Part 1: • How to make a chart dynamic with inpu...
Watch Part 2: • How to make a chart dynamic with inpu...
Watch Part 3: • How to add a dynamic colorpicker inpu...
▬ Chart JS 4.2.1 ▬▬▬▬▬▬▬▬▬▬▬▬
Chart JS is a javascript library to draw charts in the canvas tag on your site. Presenting data in a visual manner such as charts is more effective and appealing. All the charts are always coded in the latest Chartjs version which is as of this recording Chart JS 4.2.1.