Building an XData Charting Web Service from Scratch - Part 3
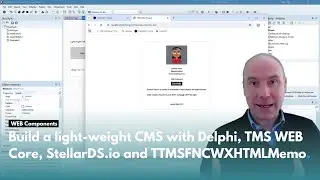
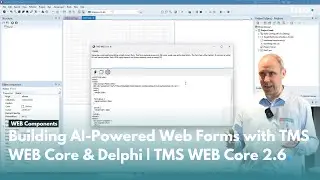
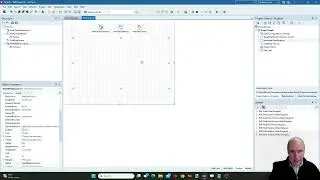
In this tutorial, we're tackling an exciting task: building a new endpoint to show data inside our charts. We've already set up endpoints for symbols and years in our database. Now, using Chart.js and Delphi's TJSON objects, we're creating dynamic JSON responses directly from our server. Our goal is to make flexible, data-driven line charts that display end-of-day stock values over time.
PREVIOUS VIDEOS:
Introduction: • Building an XData Charting Web Servic...
Part 1: • Building an XData Charting Web Servic...
Part 2: • Building an XData Charting Web Servic...
MORE INFO:
TMS XData: https://www.tmssoftware.com/site/xdat...
Source code: https://github.com/holgerflick/xdata....
CONNECT:
Newsletter: https://www.tmssoftware.com/site/news...
Facebook: / tmssoftware
X: / tmssoftwarenews
Threads: https://www.threads.net/@tmssoftware
LinkedIn: / tmssoftware-com
Instagram: / tmssoftware
ABOUT:
TMS software, established in 1995, is a software development company specialized in:
VCL, FMX, FNC, .NET, WEB component development
Windows, Web, Android, iOS, macOS, Linux, Raspberry Pi development projects
Training, consulting & custom project development