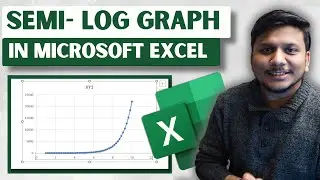
How to plot Semi Log graph in excel
Learn how to create a semi-log graph in Microsoft Excel with this easy-to-follow tutorial.
🔔Don't Forget To Leave A Comment, Subscribe To The Channel - Respect For Your Support
📌Timestamps📌
00:00 - Introduction
00:28 - Insert a Scatter Chart
00:45 - Select Your Data
01:28 - Set Logarithmic Scale
02:00 - Customizing setting
02:16 - conclusion
🏷️ Hashtags:
#SemiLogGraph #ExcelTutorial #DataVisualization #LogarithmicScale #scatterplot
semi-log graph, Excel tutorial, data visualization, logarithmic scale, scatter plot, Excel charts, graphing in Excel, plotting data, Excel tips, data analysis, scientific data, orders of magnitude, chart customization, axis formatting, chart title, axis labels, example use case, Excel skills, data communication
semi log graph,semi log graph in excel,Semi Log Graph In Excel,plot semi log graph in excel,how to plot a semi log graph in excel,semi log excel,excel semi log,how to plot semi log in excel,how to create a semi log graph in excel,how to make semi log graph in excel,plot semi log in excel,semi logarithmic graph excel,semi log,how to draw semi log graph in excel,how to plot semi log chart in excel,semi log plot excel,make semi log graph in excel,create semi log graph in excel