ROC and AUC in R
This tutorial walks you through, step-by-step, how to draw ROC curves and calculate AUC in R. We start with basic ROC graph, learn how to extract thresholds for decision making, calculate AUC and partial AUC and how to layer multiple ROC curves on the same graph.
You can get a copy of the code from the StatQuest GitHub, here:
NOTE: This StatQuest builds on the example in the original ROC and AUC StatQuest:
Also, if you're curious, here are some links to StatQuests about...
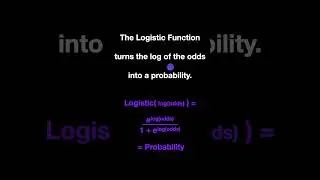
...Logistic Regression
...and Random Forests...
For a complete index of all the StatQuest videos, check out:
If you'd like to support StatQuest, please consider...
Buying The StatQuest Illustrated Guide to Machine Learning!!!
PDF -
Paperback -
Kindle eBook -
Patreon:
...or...
YouTube Membership:
...a cool StatQuest t-shirt or sweatshirt:
...buying one or two of my songs (or go large and get a whole album!)
...or just donating to StatQuest!
Lastly, if you want to keep up with me as I research and create new StatQuests, follow me on twitter: