Data Modeling, Creating Relationships, and Tables using DAX (Indigeno Technologies - Part 1)
This tutorial creates a data model and visualizes a flow of orders in Power BI. Here's a summary:
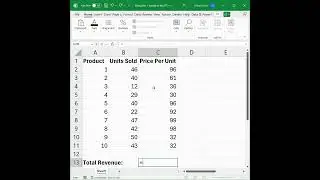
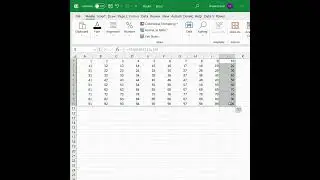
We start with 11 excel tables related to orders.
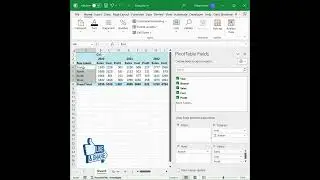
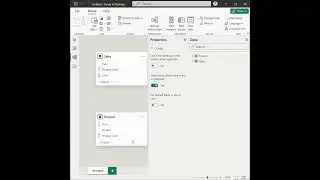
We import them into Power BI and create relationships between tables based on matching columns (e.g., product ID).
We use DAX queries to create new tables containing order flow information (e.g., flow from broker to supplier).
We create a single table "Flow All" combining all flow information using the UNION function.
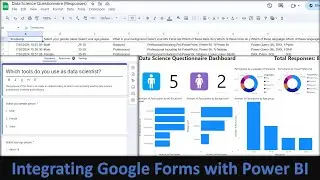
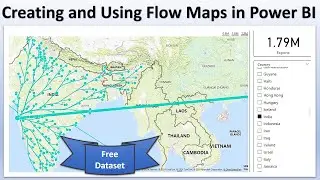
We use a Sankey chart (imported custom visual) to visualize the flow of orders from brokers to buyers.
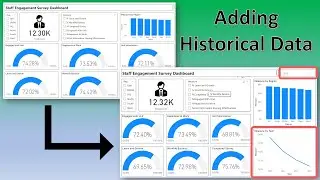
We add slicers to filter by year and quarter.
We format the visuals with borders and rounded corners.
#PowerBI #datavisualization #datamodeling #sankeychart #DAX #tutorial #businessintelligence #dashboard #orders #reporting #howto