Webinar: Peak detection and quantification for ChIP-seq, ATAC-seq and similar data
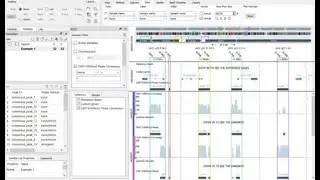
The Qlucore NGS module contains powerful functionality for peak detection and peak quantification. In this webinar we will show how to detect peaks and visualize them in the genome browser in Qlucore Omics Explorer.
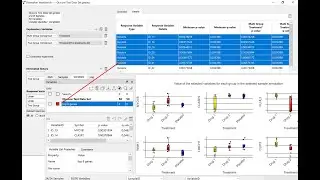
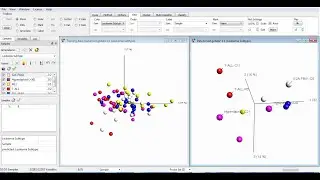
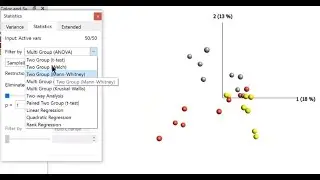
A detailed list of the peaks will be exported including information of corresponding genes, peak features etc. Quantification will be performed as part of the processing, statistical analysis will be performed on the quantified peaks and the results will be visualized in parallel PCA-plots and heatmaps.
#dataanalysis #bioinformaticsoftware #omics
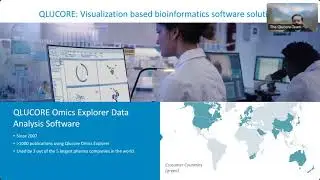
Qlucore Omics Explorer is a D.I.Y next-generation bioinformatics software for research in life science, plant- and biotech industries, as well as academia. The powerful and flexible visualization-based data analysis tool with inbuilt powerful statistics delivers immediate results and provides instant exploration and visualization of big data.
The software is developed to allow the workflow which best suits you and your experiments and maximizes the outcome of your research.
Subscribe here https://www.youtube.com/channel/UCaXb...
___________________________________________________
For more videos and webinars https://www.qlucore.com/videos
Download Qlucore Omics Explorer 10 Days Free Trial https://www.qlucore.com/evaluation _________________________________________________________________________
Our Social Media:
Linked in / qluc. .
Facebook / qlucore
Twitter / qlucore