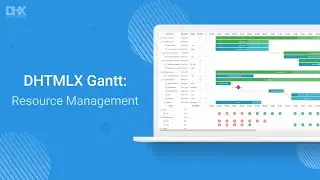
Resource Management in JavaScript Gantt Chart - DHTMLX Gantt
Here is an overview of resource management functionality in the DHTMLX JavaScript Gantt chart with code snippets attached.
One of the most popular DHTMLX Gantt features is displaying resources: https://snippet.dhtmlx.com/5/6c58f6244
It is possible to show any HTML elements in the grid and timeline area of the resource diagram:
https://snippet.dhtmlx.com/5/248a87f90
You can add the calculation logic to DHTMLX Gantt and render all the data you need.
Calculating the workload depending on the shift hours: https://snippet.dhtmlx.com/5/2548caf68
Displaying hours and tasks per day: https://snippet.dhtmlx.com/5/03c9bf229
Showing values from the array with dates:
https://snippet.dhtmlx.com/5/a10e81eeb
https://snippet.dhtmlx.com/5/ed4aff39a
Allocating the capacity in the Resource Histogram: https://snippet.dhtmlx.com/5/eda3e25b6
Our samples provide possible options on how to implement the calculation logic. Based on that, you can create your own custom solution: https://docs.dhtmlx.com/gantt/samples/
Download a free 30-day trial version of DHTMLX Gantt: https://dhtmlx.com/docs/products/dhtm...


![How to Create Scheduler in Salesforce - DHTMLX with Lightning Web Components [Installation Guide]](https://images.videosashka.com/watch/IceDT8O1Pys)


![How to Create Gantt Chart in Salesforce - DHTMLX with Lightning Web Components [Installation Guide]](https://images.videosashka.com/watch/cCvULTQxPfg)

