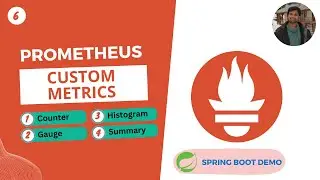
Prometheus Custom Metrics
📈 Unlocking Custom Metrics in Prometheus! 🚀
🔍 #Prometheus #CustomMetrics #Monitoring #DevOps #HandsOn
In this chapter, we delve into the realm of custom metrics, exploring how to generate metrics tailored to your application's specific needs. From tracking the number of todo items created to monitoring pending tasks, we explore the intricacies of custom metric generation with Prometheus.
📊 Types of Metrics Explored:
1. Counter
2. Gauge
3. Histogram
4. Summary
Each metric type serves a unique purpose, from counting occurrences to measuring performance in different scenarios. I tried to provide detailed explanations and practical examples for each, ensuring a comprehensive understanding of custom metric generation.
🛠️ Hands-On Demonstration:
Follow along as I demonstrate how to generate custom metrics of all types in our Spring Boot todo application. Utilizing the Micrometer dependency, we showcase step-by-step implementations for counters, gauges, histograms, and summaries.
🚀 Seamless Integration with Prometheus:
With our custom metrics exposed on the application endpoint, deployment to Minikube is a breeze. Thanks to Service Discovery and annotations added to our todo service, Prometheus effortlessly scrapes our custom metrics without any additional configuration.
👍 Don't Miss Out:
If you're looking to enhance your monitoring capabilities with custom metrics, this video is a must-watch! Like, share, and subscribe to stay updated on the latest tech tutorials and hands-on demonstrations.
📚 Explore More Tutorials:
Docker Complete Course: • Docker Tutorial | Full Course in 2 H...
Kubernetes Series: • Kubernetes Zero to Hero
HELM: • All about HELM
GitHub: https://github.com/pelthepu/todo-api/...
🙏 Thank you for tuning in! Stay tuned for more insights into Observability and Monitoring with Prometheus!