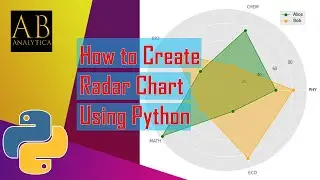
How to create Radar chart in Python using Matplotlib
Radar chart, also called as Spider chart or Web chart is a graphical method used for comparing multiple quantitative variables. It is a two dimensional polar visualization.
This is a tutorial on how to prepare a radar chart in python.
Medium Article:https://towardsdatascience.com/how-to...
You can contact me:
Twitter: / hashabcd
Medium: / abhijithchandradas
Linkedin: / abhijithcs
MEDIUM MEMBERSHIP
You can support me by joining Medium Membership program by using my referral link: / abhijithchandradas ...
Your membership fee directly supports me and other writers you read. You'll also get full access to every story on Medium.
Code for the above video can be downloaded from my GitHub Repo:https://github.com/hashABCD/Publicati...


![Star Citizen - Making Money with an Aurora [GIVEAWAY]](https://images.videosashka.com/watch/o7JyUhfZ3Wo)