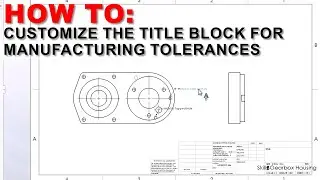
Quickly Review Flow Results with a Cut Plot |
Learn about SOLIDWORKS public and custom training at https://www.mlc-cad.com/training/soli...
Cut plots visualize results in a cross-section and are one of the easiest ways to review computational fluid dynamics results. Plots can be configured to display the mesh overlay, flow lines, or just the result display to help understand the behavior inside the study domain. The Preview button (eyeball icon at the top) makes it possible to preview plot changes in real-time. Adjust the location of the cut plane by selecting a specific entity, reference, or simply offset the standard planes visually or numerically. Further adjustments including transparency, the number of colors, and region cropping is possible inside the cut plot dialog to create visuals that help understand the flow.
Watch the entire playlist: • Flow Simulation Tips & Tricks
Post Processing Tips & Tricks
How to Select and Define Goals: • How to Select & Define Goals for #SOL...
Monitor the solver and preview results: • How to Monitor the Flow Solver & Prev...
Cut Plots: • Quickly Review Flow Results with a Cu...
Adjusting Color Charts: • Adjust Plot Limits for Maximum Clarit...
Surface Plot: • How to Plot Surface Fluid/Thermal Res...
Flow Trajectories: • Create Effective Flow Trajectory Plot...
Take Discrete or Integral Measurements: • How to Calculate Measurements in #CFD...
XY Plots: • Plot Fluid Measurements Across a Surf...
Convert Steady-State to Transient: • #SOLIDWORKS Flow Simulation Transient...
Speed up Transient Solver: • Solve Transient #CFD Studies at Recor...
Graphing Measurements over Time: • Plotting Time-Dependent Measurements ...
Creating transient result plot animations: • Visualize Dynamic Heat & Flow Plots |...
Generating Reports: • How to Generate Reports in #SOLIDWORK...
#solidworkssimulation #solidworkstips #solidworkstips #solidworkstutorial


![[FREE FOR PROFIT] Три дня дождя x МУККА type beat | Pop punk type beat -](https://images.videosashka.com/watch/xdqqIm7zulU)