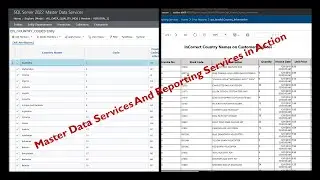
How to Perform Exploratory Data Analysis Using AWS Athena on Data Lake
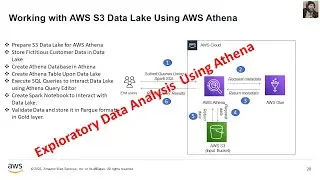
EDA stands for Exploratory Data Analysis. It is an approach to analyzing and visualizing data sets to summarize their main characteristics, often with the help of graphical representations. EDA helps data analysts and scientists get a better understanding of the data, identify patterns, spot anomalies, and test assumptions. It is a crucial step in the data analysis process and is often used before more formal statistical techniques are applied. EDA can involve techniques like creating histograms, scatter plots, box plots, and more to explore data visually and understand its underlying structure.
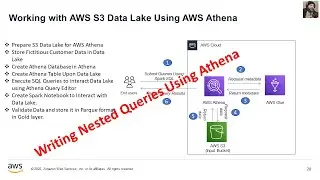
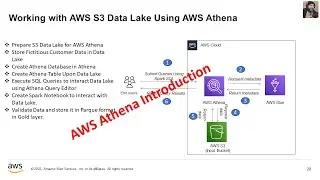
Performing Exploratory Data Analysis (EDA) using AWS Athena on a Data Lake involves leveraging the power of serverless querying capabilities for efficient data exploration. With AWS Athena, you can run SQL queries directly on data stored in your Data Lake, such as data in Amazon S3. This process allows you to gain valuable insights into your data without the need for a traditional database setup.
During EDA, you can use Athena to query, filter, and aggregate your data, visualize it, and uncover patterns or anomalies. This is particularly valuable in scenarios where you have vast amounts of unstructured or semi-structured data and need to understand its underlying structure
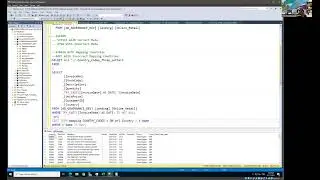
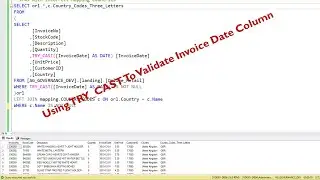
In this video, I'll guide you through some essential Exploratory Data Analysis (EDA) steps aimed at data quality validation. This process involves tasks like identifying duplicate records, pinpointing unique identifiers based on composite columns, and more.