Profitable Strategy Using Bollinger Bands and RSI Automated in Python
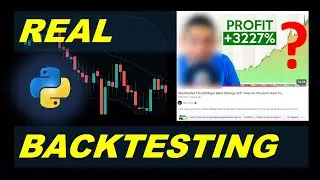
In this video, we present a profitable trading strategy using Bollinger Bands and RSI indicators, automated in Python. The strategy combines Bollinger Bands, RSI, and specific candle patterns to detect reversal points and identify optimal entry positions. We backtest the strategy using Python, accounting for commissions and spread costs, and achieve positive returns. The video covers the strategy rules, demonstrates the Python code used for backtesting, and provides a downloadable link for the code. By integrating Bollinger Bands, RSI, and Python automation, this approach aims to enhance your trading performance. Join us to learn how to implement this effective strategy and test trading results with automated Python scripts.
]]] Drop a comment if you feel like sharing and supporting with some ideas!
Subscribe for more Python trading tutorials and backtesting strategies.
📘 Book available on Amazon (Algorithmic Trading Hands-On Approach Using Python):
https://bit.ly/CouponPythonBasics
Discount Vouchers for my Algorithmic Trading and Python courses:
💲 Algorithmic Trading: https://bit.ly/CouponAlgorithmicTrading
💲 Data Analysis with Numpy and Pandas: https://bit.ly/CouponDataAnalysis
💲 Machine Learning Methods In Algorithmic Trading: https://bit.ly/CouponMachineLearningT...
💲 Python Beginner Course With Solved Exercises: https://bit.ly/CouponPythonBasics
💲 Object Oriented Programming in Python: https://bit.ly/CouponOOP
Download the Python Code (notebook):
https://drive.google.com/file/d/1zG8s...
And the data file I used in the video:
https://drive.google.com/file/d/1k2kG...
#bollingerbands #tradingstrategy #technicalanalysis #stockmarket #finance #investing #automatedtrading #algorithmictrading