DCF Excel model
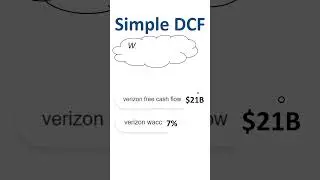
How to build a discounted cash flow model in Excel? Let me walk you through the DCF Excel model that I built for a #valuation of US telecom company Verizon. I hope it provides you with insights into the practical side of doing a DCF valuation.
⏱️TIMESTAMPS⏱️
00:00 DCF model structure
02:23 Purpose of DCF model
02:59 DCF model: P&L forecasting
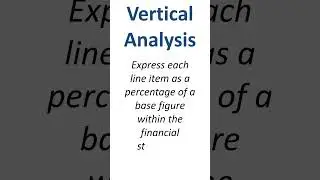
09:15 Horizontal and vertical analysis
12:59 DCF model: cash flow forecasting
16:09 DCF model: free cash flow
17:05 Applying the WACC
20:08 DCF model: terminal value
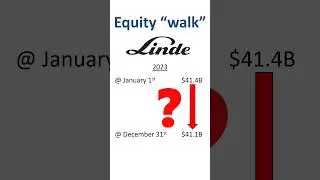
21:39 Enterprise Value to Equity Value
A quick overview of the structure of the DCF Excel model. Line item descriptions in column A, three years of historical actuals in B, C and D, and then five years of estimates. My discounted cash flow model works from left to right. Oldest year on the left, and if you go to the right, you go forward in time. For the years where I have historical actual data, I put an “A” next to the year. The source for the actuals is the 10-K annual report. When forecasting future years, I put an “E” for estimate next to the year. The source for the estimates is short-term company guidance combined with my personal educated guesses. All of these assumptions could turn out to be wrong. The future has not happened yet, and will be much weirder than we can imagine. So don’t take any DCF model too seriously.
I have frozen the top rows in the model so they stay visible while scrolling through the rest of the worksheet.
A high level overview of the line items in the #DCF Excel model. We start off modeling the P&L, or profit and loss statement. Revenue, gross profit, operating income, all the way down to net income. Then, using the indirect format of the cash flow statement, it goes from net income to cash from operating activities. CFOA minus capital expenditures equals free cash flow. That’s a very big and important line, and pretty much the whole reason we build the DCF model in the first place! The rest of the model is about applying the time value of money. It covers:
how to apply the WACC to get the present values of the forecasted future free cash flows,
how to calculate the terminal value,
and works through enterprise value and equity value in order to end up with an estimated value of the share price.
A lot of people use the #discountedcashflow method in order to decide whether to buy, sell or hold a share of a publicly listed company, based on comparing the estimated value in a DCF Excel model to the current market price, and identifying either upside or downside potential for the stock.
All of the analysis and forecasting happens in one single Excel worksheet!
The process of building a discounted cash flow model in Excel is as important as the outcome of the calculation. The process provides you with a lot of insights into the value drivers of the company.
Philip de Vroe (The Finance Storyteller) aims to make accounting, finance and investing enjoyable and easier to understand. Learn the business and accounting vocabulary to join the conversation with your CEO at your company. Understand how financial statements work in order to make better investing decisions. Philip delivers #financetraining in various formats: YouTube videos, livestreams, classroom sessions, and webinars. Connect with me through Linked In!
Want to get access to bonus content, and/or express your gratitude by buying me a cup of tea? Join my channel as a member through / @thefinancestoryteller