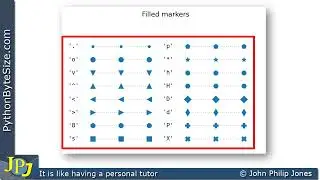
How to change the shape of Python pyplot markers
To change the shape of markers in Python's Matplotlib pyplot, you can specify the `marker` parameter in the plotting function. For example, `plt.plot(x, y, marker='o')` will display circular markers for each data point. You can choose from a variety of marker styles, such as 's' for squares, '*' for stars, and '+' for plus signs. For a comprehensive list of available markers, you can refer to the official Matplotlib documentation or the marker reference guide.