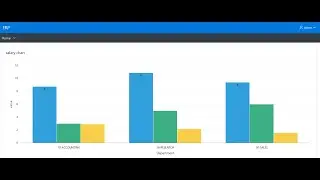
Creating Charts with Oracle APEX 19.2
Simple but useful tutorial video for creating chart with Oracle Apex 19.2
Queries are as follows:
Query1:
------------
select t1.deptno||'-'||t2.dname deptno,round(nvl(sum(sal),0)/1000,4) sal
from emp t1, dept t2
where t2.deptno=t1.deptno
group by t1.deptno||'-'||t2.dname
Query2:
-----------
select t1.deptno||'-'||t2.dname deptno,count(empno) cnt
from emp t1, dept t2
where t2.deptno=t1.deptno
group by t1.deptno||'-'||t2.dname
Query3:
-------------
select t1.deptno||'-'||t2.dname deptno,round((nvl(sum(sal),0)/1000)/count(empno),2) avgsal
from emp t1, dept t2
where t2.deptno=t1.deptno
group by t1.deptno||'-'||t2.dname