Airwindows Meter (v0.1.9): Free Mac/Windows/Linux CLAP/AU/VST3
https://github.com/airwindows/Meter/r... / airwindows
Here's Airwindows Meter v0.1.9, with even more interesting color mappings! I'm sorry the explanation is so long-winded, but this is (for now) literally unique and doing something that's never been done before. Three out of four meters here are unique and the peak meter doesn't work like anybody else's peak meter, either. So, everything that it does, takes some explaining. If you don't want that, just run lots of reference audio into it and learn how to make your audio more like your references by matching the behaviors and colors. That's fine too! Still here? OK, here's how it works.
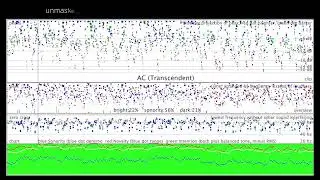
Top meter is a peak meter. NO RMS, only peak. On modern music it will show just a line of clipped bad sound, with the top of the meter representing 0dB. All the other parts also refer to what's happening to peaks. There's no display of RMS at all: that's for pretty much every other meter, and not interesting here. One exception: bass dots are sized according to RMS, so if you see a burst of green dots you know that's a bass event and can adjust it accordingly. You still want to make 'loudness' in this our modern world, but it is done through making a dense cloud of peaks from 0dB to however far down you like: -12dB or -18dB are not unusual. These are shown as dots: the color dot most likely to give you good results is blue dots. That means the loudness is being balanced by brightness correctly. If you clip there's a discreet red line down at the bottom, but you can still see what's happening with the other peaks.
The second (now half-height) display is a Slew meter. It's showing exactly the same information, but organized differently. On the slew meter, brighter is higher up. (if you have red/green color blindness, 'gred' dots above the blue dots are brighter, and below the blue dots are darker/bassier). On this meter, the red (bright) dots are drawn more obviously, and the green dots are a lot more subtle because it's the 'bright' meter and bassy stuff is the backdrop. This too can produce red warning signs at the bottom, 'over-slews' meaning your stuff threatens to be way too bright to sound good. This meter also gives you a running average of the brightness of your peaks: having bright and dark in balance is good, but you can either balance them or just have everything 'loud' and rely on sonority. That works too.
The third (now half-height) display is a Zero Cross meter. That represents the bass balance: if a low tone is causing the waveform to go many samples without crossing zero, and you make high frequency information louder, you'll interfere with the Zero Crossing and it'll fail to register the bass (just as the listener will fail to hear the bass if you've got the balance wrong). This one's marked in hertz: a line up top shows 200 hz (common for old retro sounds that lack bass, and there'll be a cloud up there if you don't have good bass extension), then there's another line at 40 hz (of interest to dance/EDM producers) and the bottom of the meter is 20 hz. This will immediately show you if your sub-bass is absent or out of control, no matter what speakers you have. The dot size shows RMS here (like the green dots on the Peak meter)
and with a little practice it should speak volumes to anybody needing to work with heavy and deep bass and have it translate.
The fourth display is too complicated to describe here so follow the link :)