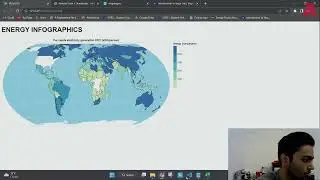
Embedding a map visualization using Vegalite in html
We'll generate a map visualization for the energy consumption of different parts of the world, this will all be done using vegalite which uses simple and concise syntax to make interactive graphics.
-----------------------------------------
To learn more about The Assembly’s workshops, visit our website, social media or email us at [email protected]
Our website: http://theassembly.ae
Instagram: / makesmartthings
Facebook: http://fb.com/makesmartthings
Twitter: / makesmartthings