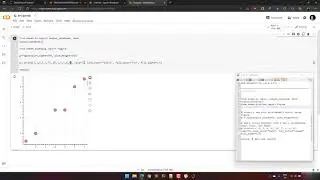
Viridis Color - Scatter plot
music by: NCS
thanks for watching. subscribe, share, like, comment.
#sinewave #numpy #python
viridis is a colormap in matplotlib. Colormaps are used to map data values to colors in a visualization. The viridis colormap is known for its perceptually uniform and visually appealing color progression, making it a good choice for representing numerical data.
In this example, the cmap='viridis' parameter in the scatter function specifies that the viridis colormap should be used to map the y values to colors. The colorbar function adds a colorbar to the plot to provide a reference for the color mapping.
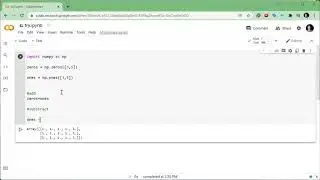
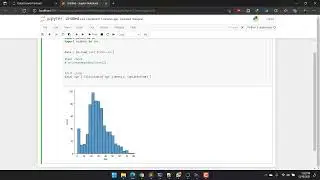
when you call np.linspace(0, 10, 100), you're asking NumPy to generate an array of 100 numbers that are evenly spaced between 0 and 10. This is often used in creating a range of values for plotting or other numerical computations.


![JS - Depth First Search - DSA Practice [ASMR]](https://images.videosashka.com/watch/PcHLv8t5yo0)
![JS - Breadth First Search Algorithm [ASMR]](https://images.videosashka.com/watch/6PlCa819avo)
![JS - Graph, Adjacency Lists, Algorithm [ASMR]](https://images.videosashka.com/watch/QlbkdeM-h5E)


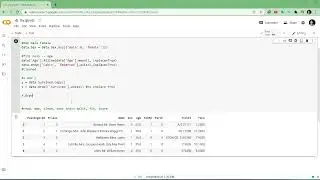
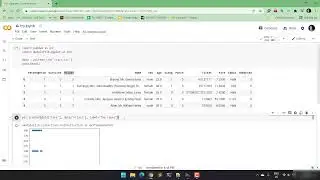
![Python - airlines tweets sentiments / pie chart, bar plot [keystrokes]](https://images.videosashka.com/watch/StB8uxyfRPE)