CREATE 9 Stunning Charts with Chart.js and MASTER Data Visualization!
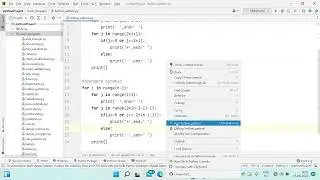
In this Chart.js tutorial, I’ll show you how to visualize data on the web using JavaScript. You’ll learn how to create 9 different chart types, including bar charts, line charts, pie charts, and more! Chart JS is a powerful, lightweight, and open-source JavaScript charting library that lets you build interactive and responsive charts using HTML5 Canvas. Whether you're a beginner or an experienced developer, this step-by-step tutorial will help you master data visualization for your web applications and dashboards. Want to Master Chart JS? Watch This Chart.js Tutorial.
🎞️ TABLE OF CONTENTS 🎬
0:00 Introduction
1:37 Charts Preview
4:14 Getting Started with Chart.js
5:29 Creating a Bar Chart
11:05 Creating a Bar Chart with Multiple Datasets
13:31 Creating a Horizontal Bar Chart
14:25 Creating a Line Chart
19:37 Creating a Multi-Axis Line Chart
24:23 Creating Doughnut and Pie Charts
27:38 Creating a Radar Chart
34:43 Creating a Scatter Chart
39:45 Customizing Tooltips in Chart.js
41:27 End Screen
💻 Source Code
📂 https://github.com/saeedkohansal/Char...
🔴 Chart.js Examples Live Demo
🔗 https://saeedkohansal.github.io/Chart...
📊 Chart.js Official Website
🔗 https://www.chartjs.org/
📚 Chart.js Documentation
🔗 https://www.chartjs.org/docs/latest/
🐙 Chart.js GitHub Repository
🔗 https://github.com/chartjs/Chart.js
⭐ Useful Links
🔗 https://www.chartjs.org/docs/latest/g...
🔗 https://www.chartjs.org/docs/latest/g...
🔗 https://www.chartjs.org/docs/latest/c...
🔗 https://www.chartjs.org/docs/latest/c...
🔗 https://www.chartjs.org/docs/latest/c...
🔗 https://www.chartjs.org/docs/latest/c...
⏯️ What You’ll Learn:
🟢 How to set up ChartJS in your project.
🟠 Step-by-step creation of 9 different chart types.
🟡 Customization tips to make your charts stand out.
🟣 Best practices for data visualization in web development.
#chartjs #datavisualization #webdevelopment #javascript #gilgeekify


![CALLIGRAPHY ON IPAD TABLET [Arabic script on an abstract background]](https://images.videosashka.com/watch/Uu6CVlzLGhA)