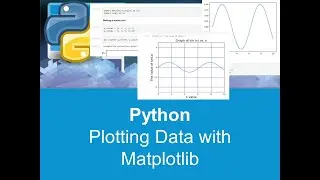
Python In Excel. Displaying DataFrames in Excel.
In this video I am explaining how to display a Python dataframe in Excel.
Completely. With a few tricks.
The video "builds upon" this one - • Python In Excel Linear Regression and can be considered its second part.
Contents:
Display DataFrame in Excel
A few tricks with DataFrames
display columns names in Excel
display sliced dataframe
Get unique values of dataframe (value_counts)
Get percentages of unique values of dataframe (value_counts(normalize = True)