How To Use Graphs In Power Apps - Make Dashboards Or Reports!
Want to make your Power Apps data come to life? 📊 In this tutorial, we’ll show you how to create and use interactive graphs in Power Apps to visualize your data effectively! Learn how to add line charts, bar charts, and pie charts to your app, as well as customization basics. This will also cover the Collect and ClearCollect functions.
This will cover everything from the basics of chart creation to advanced tips for connecting your charts to a source and making them interactive. Perfect for Power Apps beginners and seasoned developers looking to enhance their apps with engaging visuals!
Power Apps Playlist: • Power Apps
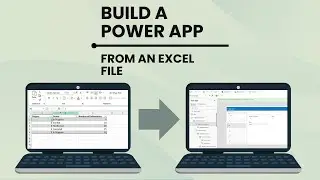
Shorter version of making a Power App from an Excel file: • How To Make A Power App From An Excel...
From the video:
https://learn.microsoft.com/en-us/pow...