126 тысяч подписчиков
164 видео
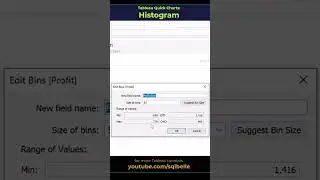
#Tableau Histogram using built-in Bins #tableaututorial #tableauvisualization #tableautips #chart
#Tableau
Tableau, LOD and SQL - Behind the scenes | sqlbelle
Dynamic Zone Visibility | Comprehensive Tableau Tutorial with 4 Practical Use Cases
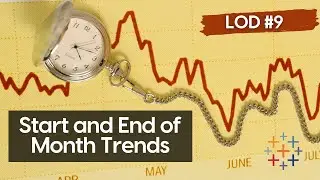
LOD #9 - Investigate First and Last Day of Period Values
Tableau Filters - Comprehensive Tutorial including Context Filter, Cascading Filters | sqlbelle
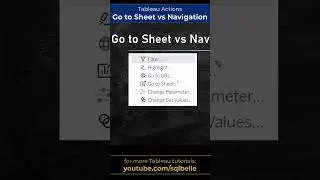
Introduction to Tableau Actions + Filter Actions demos + BONUS Topics
LOD #1 - Calculating Customer Order Frequency -
What are the different
LOD #7 - Average of Top Values - What is the avg of max sales per location
Tableau Filter Actions Explained - Comprehensive Step-by-Step Tutorial with BONUS Topics
Tableau Tutorial - Dynamic Charts - Dynamic Sheet Swapping in Tableau
Tableau Sets and Set Actions Comprehensive Tutorial | sqlbelle
Additional Ways to Visualize Data - BANs, Circos, Sankey, Sunburst, Pictograph, Trellis, and more
Bullet Chart - Complete Tutorial w Relationships, Calculations | Tableau for Beginners
Chart Tip - Make your point obvious (simple chart makeover) | Tableau Charts | sqlbelle
LOD #2 - Cohort Analysis -
LOD #6 - Comparative Analysis - How does one category compare to another
LOD #4 - Percent of Total - LOD vs Table Calculations
LOD #3 - Daily Profit KPI - Percentage of Profitable vs Unprofitable Days
LOD #5 - New Customer Acquisition Trend
How to Connect with Your Audience Through Data Stories
Learn Tableau Basic Calculations (Calculated Fields) in Tableau (with 10+ examples) | Part 1
Tableau Tutorial - Top 6-10 LOD Expressions - Practical Examples (Part 2 - LOD calculations)
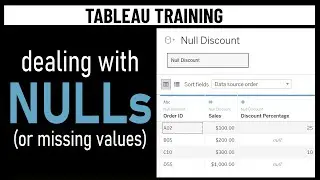
Dealing with NULLs (or missing values) in Tableau | Tableau Training | sqlbelle
Tableau and Custom SQL - plus stored procedure, parameters and initial SQL | sqlbelle
Tableau Multiple Map Layers (new in v2020.4) - Complete Tutorial with real world data set | sqlbelle
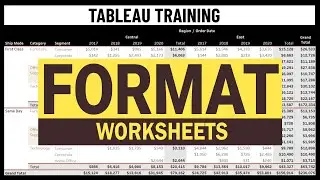
Tableau Tutorial - Format Worksheets in Tableau - Comprehensive Tutorial for Beginners
Tableau Groups vs Sets - Comparison and examples (proportional brushing, top and bottom values)
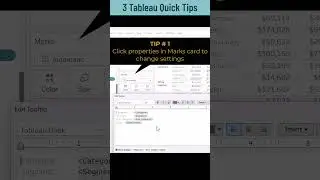
3 Tableau Quick Tips
Data Literacy and meteorites: How to avoid creating beautiful graphs with wrong conclusions
#tableau
Tableau Dashboards | 7 Practical Tips and Tricks | Tiled, Floating, Containers, Formatting, Colors
5 free resources for
Tableau Prep - Add Rows for Daily and Monthly Reports / Dashboards | sqlbelle