How to create 100% stacked column chart in power bi
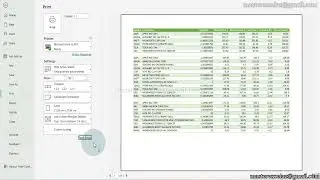
Raw data for power bi practice download :
This video shows you how to create 100% Stacked column chart visualization for gym products sales share % analysis in MS Power BI Desktop.
Excel Tips & Tricks :
Excel Analysis :
Excel Functions :
Excel DAX formulas :
Excel for Job Interview :
Excel 365 Features :
Excel 2019 Features :
Mobile Excel Tutorial :
Creative & Advanced charts :
Excel Automation :
450 Excel functions with examples :
50+ Important excel functions with examples :
Top 60 widely using most popular excel functions :
Different types of MIS reports & dashboard creation :
HR MIS dashboard using Power Pivot :
Thank you for watching this video !!


![PlayerUnknown’s Battlegrounds. Питничный стрим [1440]](https://images.videosashka.com/watch/RGqikbXTuH4)