This is the second part of the climate change analysis. In this video we will use plotly to create an attractive and interactive graph. Here is the link to the files for this course: https://github.com/captainnima/python.
билборды - Рисую кровью (Guitar cover + ТАБЫ)
Я РЖАЛ ДО СЛЕЗ😂 15 Минут ОТБОРНЫХ ПРИКОЛОВ 2025 Смешные видео - Лучшие ПРИКОЛЫ
Fix "There was an error processing a page. There was a problem reading this document (14)" PDF error
Короткоходная кулиса на ВАЗ. Плюсы и минусы. Почему нужно ставить жесткий карданчик кулисы КПП?
[FREE] Freestyle Type Beat - "Night" | Free Type Beat 2023 | Dark Trap Instrumental
Through My Window: Across the Sea - Ares & Raquel Kissing Scene | Clara Galle | Netflix
Немного о "Короткоходной кулисе" на Приору.
How to pair MI REDMI Earbuds master bud with another bud connecting each other
058 Cursors
057 More Views
056 Restoring AdventureWorks Sample Databases
055 Fresh Install of SQL Server 2019
007 WAN Frame Relay
006 WAN
005 LAN With Internet Access
004 LAN With A Switch
002 Packet Tracer
003 Simple LAN
001 Introduction
039 Reading Raw Data
038 Web Scraping
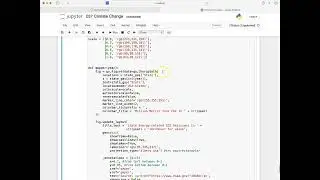
037 Climate Change Part 2
037 Climate Change Part 1
036 XML
035 JSON
034 CSV
033 First Order Functions (First Class Functions)
032 Decorators
031 Generators
030 Iterators
029 Context Managers
028 Regex