python data analysis tips seaborn boxplot when how and why to use a boxplot
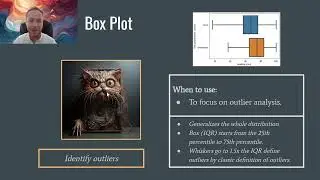
data analysis tips in python for using seaborn's boxplot functions. Why would you use a boxplot versus a histogram? learning arguments to control which outliers your focusing your analysis on.
watch more videos at the DataBlog
https://www.datasimple.education/blog
Use the link for a discount 30% on first class with Data Science Teacher Brandyn or any language teacher
https://preply.com/en/?pref=NDU3ODY5OQ==
Send me a message if you have any questions
/ datascienceteacherbrandyn
Showcase your DataArt
/ 1038628576726134
Python data analysis group, share your analysis
/ 1531938470572261
Machine learning in sklearn group
/ 575574217682061
Join the deep learning with tensorflow for more info
/ 369278408349330
How to video library
https://datastudio.google.com/u/0/rep...