Create Dynamic Charts in Excel Easily, using a New Formula/Function
Excel Chart Tutorials:
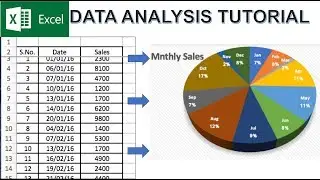
Learn how to create dynamic chart ranges in Microsoft Excel. This way you can create a perfect chart even when the data range gets bigger or smaller based on criteria. No more white space or empty spaces in your chart. If you have this in place, and you create an Excel chart based on this range, the chart will automatically adjust as the range gets smaller or longer. This is a great time-saving feature specially when you create Excel Dashboards.
Excel Filter Function Tutorial : • Excel Dynamic FILTER Function to Retu...
Software Tools/Products by Teknisha:
🔷 https://gumroad.com/teknisha🔷
Recommended Gadgets/Products:
https://www.amazon.in/shop/teknisha
Must Watch Playlists..
Excel Tutorials:
• TEKcel Series : Excel Tutorials
• TEKcel Chart Tutorials (Excel)
Excel Pivot Table Tutorials:
• Excel Complete Pivot Table Tutorials ...
Excel Gsuite Tutorials:
• Gsuite Tutorials
Excel Tips & Tricks:
• TEKcel Tips : Excel Tips & Tricks
Powerpoint Tutorials:
• Tekpoint Series : Powerpoint Tutorials
App Reviews: • Apps
Gadget Reviews:
• Gadget Reviews
Thanks for watching!!! 😊🙏
Please do Subscribe and Hit the Bell 🔔icon to receive all my videos Notifications.
CLICK HERE TO SUBSCRIBE 👉 https://tinyurl.com/TeknishaSubscribe
Follow me on below to stay connected👇
👉FaceBook: / teknisha
👉Instagram: / teknisha_


