GopherCon 2024: Advanced Code Instrumentation Techniques for High-Performance Trading Systems
Instrumentation of code for the collection of runtime metrics is undeniably essential for monitoring the health of a system and plays a critical role in enhancing its performance. Yet, this vital practice often comes at a cost, redirecting valuable CPU resources from core functionalities to the collection of runtime data.
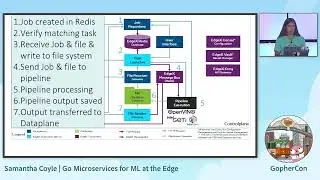
In this presentation, we'll uncover the unexpected impact that casually implemented code instrumentation for gathering runtime statistics can have on performance. We’ll explore how code instrumented on the hot path can significantly elevate execution times, especially when the instrumented code path involves frequent function calls that read from and/or write to shared data structures, which in turn increases the memory footprint that needs to be later garbage collected. The narrative then delves into the code instrumentation patterns and strategies employed to mitigate these effects, including the strategic use of buffering and channels for asynchronous processing, memory pre-allocation for better memory efficiency, batching statistics for processing to shorten the instrumented code path, to name a few. All these measures are designed to align with and exploit Go’s distinctive features effectively. This presentation aims to illustrate how strategic monitoring efforts can indeed complement, rather than compromise, the efficiency of critical operations.


![Best Dubstep Mix 2021 [Brutal Dubstep Drops],Gaming Dubstep Mix](https://images.videosashka.com/watch/hskp_5uxw00)
![Everyone Bullies Ui-mama With Ui-Beams (Koyori, Lize, Furen, Haneru, Patra, Siro, Aoi) [Eng Subs]](https://images.videosashka.com/watch/2kYfGFujdVs)