Beginners Guide To Make Better Density ECDF Plots!
In this video, we'll be walking you through the basics of density ECDF plots, including how to create them, what to use them for, and some tips for customizing them.
ggplot is a powerful tool that can be used to visualize data in a variety of ways, and density ECDF plots are one of the most commonly used plots. In this video, we'll go through the basics of how to create and customize a density ECDF plot, so that you can start using ggplot to its fullest potential!
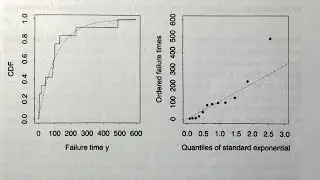
In this video I use ggplot to make an ecdf plot. I walk through some of my personal preferences when plotting.
Software Used:
📽️ [LGPL] ffmpeg: https://ffmpeg.org/
R [MIT] R: https://www.r-project.org
Davinci Resolve [Proprietary]
VSCode [MIT]
00:00 - Start
01:32 - Initial ECDF Plot
01:47 - Dark Theme
02:37 - Clear x and y axis
04:03 - First point marked
04:43 - Make the width much wider then the height
07:02 - Final Plot


![Lightning-Fast Setup: Get VS Code & Python Up and Running in No Time [Windows | 2023]!](https://images.videosashka.com/watch/EdxAUXXGB_M)