plot many distribution with for loop and seaborn
More Guided Projects at DataSimple.education Free To Use Python Template Included
https://www.datasimple.education/data...
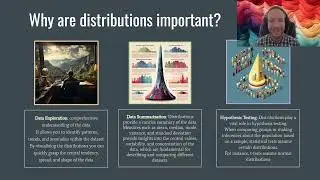
Use a for loop to loop through a list of the columns and using them to plot each distribution. It is very important to understand the distributions of our dataset.
watch more videos at the DataBlog
https://www.datasimple.education/
data analysis tips
https://www.datasimple.education/data...
This is meant to be a showcase of how I approach data science. If you're interested in learning more visit my profile to reserve a class now. Send me a message to get a copy of my full syllabus for my programs: basic python, data analyst, data science.
Get a discount on your first class with this link.
https://preply.com/en/?pref=NDU3ODY5OQ==
Access the workbook here.
https://github.com/brandynewanek/guid...

![[FREE] SLIMESITO x BEEZYB TYPE BEAT 2022 -](https://images.videosashka.com/watch/1EoTITwenvE)