Create Infographics WITHOUT Custom Visuals in Power BI ✨| Create Dynamic visuals with SVG and DAX ⚡
In This Video
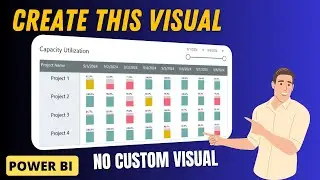
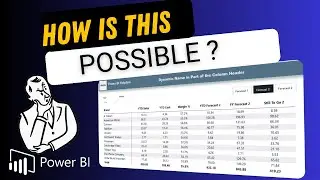
Many times you need to create infographics and you may not be allowed to use custom visuals in your organizations. Here you will learn, how to create such amazing visuals without using any custom visuals in Power BI.
We will use the Power of DAX and SVG codes to create a visual which will represent percentage of total sales by gender.
Get Help into Questions Related to #powerbi , #dax , #powerquery Power BI #datamodeling , #analysisservices and #powerbiservice
Check out our website www.powerbihelpline.com and blog-post. for end-to-end power BI solutions, Power BI templates, or any kind of Power BI questions like Power query errors, Authoring and optimizing DAX codes for complex business logic.
Follow us on LinkedIn
/ power-bi-helpline-22a2a2244
Email- [email protected]
@PowerBIHelpline


![Star Citizen - Making Money with an Aurora [GIVEAWAY]](https://images.videosashka.com/watch/o7JyUhfZ3Wo)