Power BI Tutorial for Beginners: Create your first Power BI report and dashboard in 10 minutes
Learn how to start from a simple CSV file and create a Power BI report AND interactive dashboard with geographic visualization in minutes. All this without using Excel.
Understand Power BI in just 10 minutes. Look at the entire lifecycle. Appreciate the simplicity and ease. Start your journey into Power BI.
Download the sample file for this video and follow along: https://hi.switchy.io/blpbisample
--------------------------------------------------------
Map not working? Watch this video
--------------------------------------------------------
Update: To Plot cities - go to Data tab - Choose City column - From Column tools open the Data Category drop down and choose Place. Now the map will show all cities. Watch this video for details • Create map from city names in Power B...
Contents
---------------
Intro (00:00)
How to create a FREE Power BI account (00:17)
Overview of the steps required for creating your first Power Bi Desktop dashboard (00:00:32)
Download Power BI desktop (00:48)
Sample CVS File: http://bit.ly/nitincsv1 (01:02)
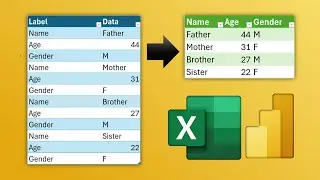
Import Data to Power BI Desktop (01:22)
Create a Power BI desktop Report (02:38)
Create a map 04:45
Power BI Amazing Filter capability: Anything which is plotted is a Filter (05:49)
Ctrl + Click to select multiple fields (06:14)
Publish a Power BI desktop report to Power BI site (06:26)
Power BI report browser view (07:06)
Create a Power BI dashboard (07:40)
Share a Power BI dashboard (08:27)
Power BI natural Language Q&A tool: Ask a question in simple English and get answered instantly (08:39)
Power BI app on mobile (09:50)
Udemy Courses by Dr Nitin Paranjape
Pivot Table Advanced - https://hi.switchy.io/22B1
Excel to Power BI - https://swiy.io/pivotsh
Dr. Nitin Paranjape (Office MVP)
Efficiency365.com
https://efficiency365.com
Video created using Camtasia
https://www.techsmith.com/store/camtasia
Download Power BI Desktop from https://powerbi.microsoft.com/en-us/d...