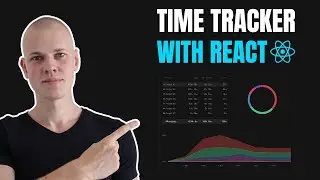
Developing a Dynamic Report for a Time-Tracking Application | React & TypeScript
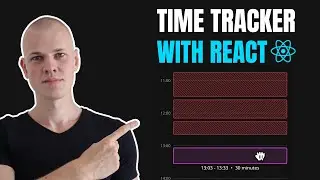
In this tutorial, we dive deep into building a comprehensive report for the Increaser time-tracking application. Learn how to create a fully customizable report featuring filters, tables, and charts using React, TypeScript, and CSS. We'll cover everything from data handling to visualizing your time-tracking data with pie and line charts, all without relying on external component libraries.
Demo: https://increaser.org
Source code: https://github.com/radzionc/radzionkit
Mentioned in this video:
Exploring HSLA Color Format for React: TypeScript, Styled Components, Color Variants, Colors Generator, Color Picker: • HSLA Color Format for React: TypeScri...
Utilizing Local Storage in React Components: A Comprehensive Guide: • Efficient React State Management with...
How To Make Pie Chart with React and SVG: • How To Make Pie Chart with React with...
Building a React Line Chart Component: A Comprehensive Guide: • Creating a React Line Chart Component...
Building a React Line Chart Component: A Comprehensive Guide: • Creating a React Line Chart Component...
Accelerate your work and reach your goals faster with https://increaser.org – where deep work, time mastery, and habit shaping converge for your success! 💪🚀


