Custom Visuals without Coding in Power BI | What is Charticulator in Power BI ?
In This Video -
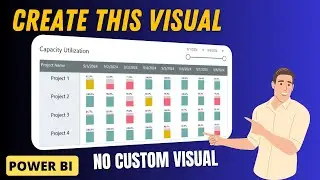
CHARTICULATOR (which is a tool to develop custom visuals without coding)
Radial Bar chart and radial Column chart for Power BI
These visuals can also be exported as HTML or image format and can be used at any other place.
Get Help into Questions Related to #powerbi , #dax , #powerquery Power BI #datamodeling , #analysisservices and #powerbiservice
Our videos are mostly specific to real time challenges faced into Power BI projects and its solutions. We use smart and most efficient techniques to solve such challenging situations in Power BI and DAX.
Checkout our playlist and SUBSCRIBE to our channel, for all such interesting topics in Power BI.
Check out our website www.powerbihelpline.com and blog-post. for end-to-end power BI solutions, Power BI templates, or any kind of Power BI questions like Power query errors, Authoring and optimizing DAX codes for complex business logic.
Follow us on LinkedIn
/ power-bi-helpline-22a2a2244
Email- [email protected]
@POWERBIHELPLINE


![COLLAPSE [Doom] 13000 MMR Offlane Show His Signature Hero Dota 2](https://images.videosashka.com/watch/cEa3yB8XfvQ)


![[You Can't Get] Love From A Stone](https://images.videosashka.com/watch/j7jTbhXGbxs)