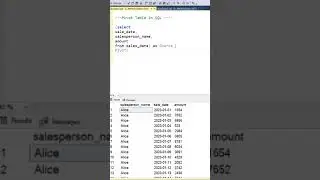
Pivot Tables in Python using Pandas
Learn how to quickly summarize your data for deeper analysis using the Pandas library and Python. You can summary your data using different aggregations, columns and indexes. You can easily switch over from Excel to Python pivot tables.
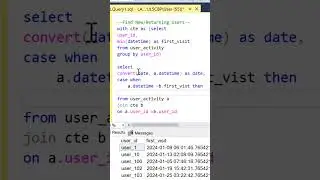
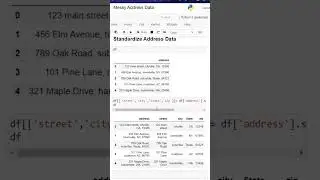
Pivot Tables are a way to statistically summarize data based on various user defined group by column and rows. This translates to the concept of data frames in Pandas which is a Python library used for data analysis
#PivotTables
#DataAnalysis
#PythonTutorial
#Excel