barcharts part1 matplotlib
#barchart,#matplotlib,#python
import matplotlib.pyplot as plt
if using a Jupyter notebook, include:
importing package
import matplotlib.pyplot as plt
import numpy as np
%matplotlib inline
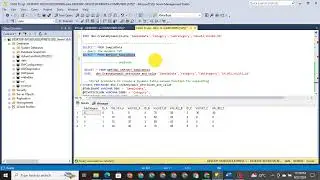
df1 = pd_readdb("SELECT top 4 make,sum(compression_ratio) as compression_ratio,sum(compression_ratio)/34 *5 as rate ,sum(compression_ratio)/34 *2 AS PEAK_RPM FROM [car].[dbo].['car_data'] group by [make] order by sum(compression_ratio) asc ")
dfmake = df1['make']
dfcompression_ratio = df1['compression_ratio']
rate = df1['rate']
ind = np.arange(len(dfmake))
#Creating a figure with some fig size
fig, ax = plt.subplots(figsize = (10,5))
#vertival
ax.bar(ind,dfcompression_ratio,width=0.4,color ='red')
#Now the trick is here.
#plt.text() , you need to give (x,y) location , where you want to put the numbers,
#So here index will give you x pos and data+1 will provide a little gap in y axis.
for index,data in enumerate(dfcompression_ratio):
plt.text(x=index , y =data+1 , s=f"{data}" , fontdict=dict(fontsize=20))
plt.tight_layout()
plt.xticks(ind, dfmake)
plt.show()