How to Visualize Data in Python Using Seaborn | Seaborn Tutorial.
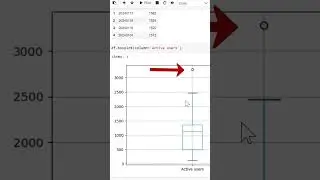
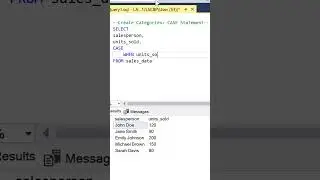
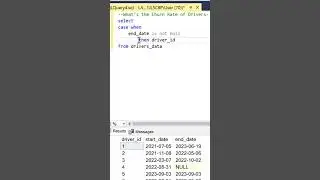
Learn how you can quickly make statistical visuals in Seaborn, Python’s best library for data visualization.
Find the notebook here:
https://github.com/Gaelim/seaborn-vis...
#datavisualization
#python
#statistics
#dataanalytics