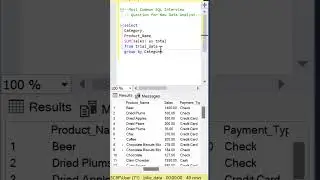
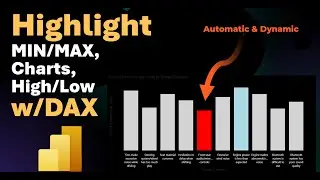
SQL Analysis Project: Identifying Outliers and Department Statistics
Join us in this exciting data analysis journey, where we unravel patterns in employee salaries and gain a deeper understanding of department statistics. Whether you're a data enthusiast, a budding analyst, or simply curious about exploring data, this video is packed with valuable insights to expand your knowledge.
Find the Dataset here:
https://github.com/Gaelim/youtube/blo...
Find me on Linkedin
/ gaelimholland
Learn and Practide SQL coding online at DataCamp, check out my affiliate link:
https://datacamp.pxf.io/KjO5ba
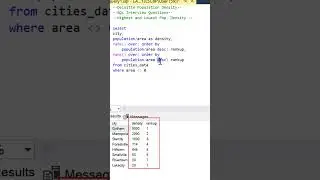
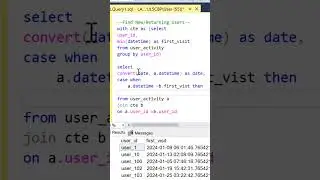
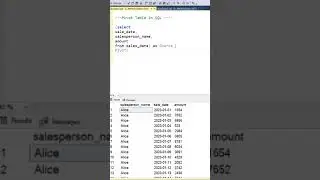
The video begins with an overview of the three parts that make up the analysis. First, we create a Common Table Expression (CTE) called "DepartmentStats." This CTE calculates the standard deviation and average of salaries for each department, filtering out salaries below $10,000.
Moving on to part two, we create another CTE named "DepartmentOutliers." This CTE combines the "Employee_Salaries" table with "DepartmentStats," enabling us to calculate the Z-scores for each salary. Z-scores help us determine how far a salary deviates from the department's average salary, taking into account the standard deviation. Again, we filter out salaries below $10,000.
Finally, we present the final query that provides valuable insights. We showcase the department, standard deviation, average, coefficient of variation (standard deviation divided by average), and the count of outliers. By utilizing a left join, we ensure that all departments are included in the analysis, even if they have no outliers. The outlier count is determined by identifying salaries that have a Z-score greater than 1.96 or less than -1.96. The results are then grouped by department, standard deviation, average, and coefficient of variation, and sorted by department for clarity.