How to Calculate Frequency Distribution in Excel
Link to the Excel file: https://agrimetsoft.com/excel
Excel Tutorial YouTube: https://bit.ly/34TTYcp
How to Calculate Frequency Distribution in Excel
===
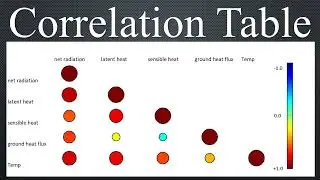
Frequency distribution simply tells you how many events, in a specific range, have happened. In order to make a frequency distribution in excel I recommend two ways. One of them is using a pivot table. The other is to use Data Analysis. For using a pivot table, you first have to make one, then apply some settings to have the frequency of events in each category. In order to use Data analysis, you first have to enable it (if you haven’t already), then make BINs values and use the Histogram option in the data analysis segment.
Tags:
frequency distribution in excel - how to make frequency distribution in excel, how to do frequency distribution in excel - how to construct frequency distribution in excel, creating frequency distribution in excel - construct a frequency distribution in excel, excel frequency distribution
excel frequency histogram, excel frequency function - frequency distribution,frequency function in excel,frequency distribution table,excel frequency table


![Spider-Man Web Of Shadows [PART 3] [LUKE CAGE GÖREVLERİ]](https://images.videosashka.com/watch/f8WpdUq2T24)