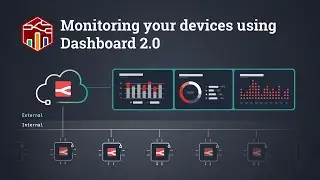
Visualising Data - FlowFuse Dashboard (Node-RED Dashboard 2.0)
Learn how to visualise your data, whether that's from an API, database, MQTT feed or elsewhere. In this tutorial, we cover the different data types you're likely to encounter in the wild, and how they can integrate smoothly in the low-code Node-RED Editor with FlowFuse Dashboard.
We cover Line Charts, Scatter Plots, Bar Graphs, Histograms, Pie & Donut Charts, as well as covering the various types of Gauges available in FlowFuse Dashboard too.
Useful Resources:
Node-RED Documentation: https://nodered.org/docs/
Dashboard Documentation: https://dashboard.flowfuse.com/
ISS Open Notify API Docs: http://open-notify.org/Open-Notify-AP...
Example Data Flow (Finance & Software Pings): https://flows.nodered.org/flow/ceb9d5...
Chapters:
00:00 Introduction
00:45 Exploring Data Types
03:45 Slider to Chart
05:28 JSON Data (Sensor MQTT Example)
08:24 API & Database Data (Star Wars Example)
14:00 Grouping Data (Finance Example)
17:40 Histograms (Software Pings Example)
23:54 Gauges (Dials, Tiles, Batteries & Tanks)
29:00 Closing Throughts