Microsoft Visio Tutorial
Are you new to Microsoft Visio and would like to learn how to draw your first diagram? In this tutorial will teach you everything you need to know.
SUBSCRIBE!!! http://howtoanalyzedata.net/youtube
-- Download Sample Visio Diagram Files [.VSDX Files] to follow along and Jump Start Your Own Diagram (E-Commerse Shopping Process, Basic Flowchart, Org chart, Agile Release Process, Salesforce Release Process, Swimlane Diagram, Simple Rectangular Room and More): https://www.howtoanalyzedata.net/dq5e
____
LETS CONNECT:
Subscribe on YouTube: https://www.howtoanalyzedata.net/youtube
Join Facebook Community (Facebook Page): https://www.howtoanalyzedata.net/face...
Connect on LinkedIn: https://www.howtoanalyzedata.net/link...
Instagram: https://www.howtoanalyzedata.net/inst...
Subscribe to Email: https://www.howtoanalyzedata.net/email
#visio #swimlane #diagram #VisioTutorial #VisioDiagrams #MicrosoftVisio
This tutorial introduces you to Microsoft Visio Tool and shows you how to create basic diagram in Microsoft Visio. Microsoft Visio is an application to create diagrams. From flow charts to floor plans to swim lane diagrams to networking diagrams and organizational charts: Visio can handle it all. In this tutorial we will look at the features of Visio and will cover creation of Visio diagrams step by step.
Microsoft Visio is software for drawing diagrams. These include floor plans, electrical diagrams, flowcharts, org charts, building plans, floor plans, data flow diagrams, process flow diagrams, business process modeling, swim lane diagrams, 3D maps, and many more.
Microsoft Visio can be used in all below settings and more:
In Architecture: Create Floor plans, plumbing and electrical diagrams
In any field: A flowchart, which can take various forms, can be used to document and analyze a process; standardize a process for efficiency and quality; communicate a process for training or understanding by other parts of the organization; and identify bottlenecks, redundancies and unnecessary steps in a process and improve it.
In software engineering and business analysis: Data flow diagrams (DFDs) can provide a focused approach to technical development, in which more research is done upfront to get to coding. Business analysts use DFDs to analyze existing systems and find efficiencies. Diagramming the process can uncover steps that might otherwise be missed or not fully understood.
In business: Business Process Modeling and Notation (BPMN) is targeted at participants and other stakeholders in a business process to gain understanding through an easy-to-understand visual representation of the steps. At a more involved level, it’s targeted at the people who will implement the process, giving sufficient detail to enable precise implementation
In chemical engineering or process engineering: A Process Flow Diagram (PFD) is a type of flowchart that illustrates the relationships between major components at an industrial plant. Diagrams can serve to document, analyze, audit, or model a better way.
In This Video
-----------------------------------------------
Here’s what you’ll learn in this video:
00:22 Introduction and Overview
00:22 Launching Visio in Windows
00:40 Pinning Visio to Windows Taskbar
00:58 Pinning Frequently User Documents
01:38 Templates (Featured and by Categories: Business, Engineering, FlowChart, Networking, Software and Database etc)
02:22 Create Sample Diagram (Student Registration Process)
03:16 Best diagrams are simple, that use fewest number of shapes to communicate the message
3:59 Sample Connecting of shapes and Adding Text To the shape
04:08 Sample of Resizing shapes
04:46 Drawing Student Registration Process diagram
05:11 Working with Shapes
05:36 Options for Connecting shapes
06:07 Resizing shapes
06:23 Rotate shapes
07:03 Formatting shapes
07:53 In-Place menu to access Shape Functions
09:23 Format Painter
10:04 Visio Stencils
10:52 Add more shapes
11:24 Choosing the right Visio Template
12:17 Recreating Student Registration Diagram from template
14:56 Ribbon interface overview (Groupings of tabs)
16:44 Type Commands (tell me what you want to do)
17:27 Quick Access Toolbar
17:55 Zoom in an out
18:36 Preview Documents in Full Screen Mode
18:58 Working with the document
19:10 Document Info and Properties
19:51 Reduce File Size
20:17 Email file as attachment or PDF


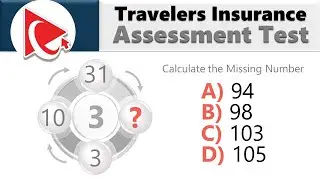
How to Pass Traveler's Insurance Pre-Employment Assessment Test: The Comprehensive Guide!
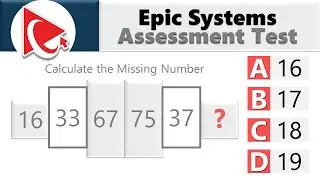
How to Pass the Epic Systems Pre-Employment Assessment: The Ultimate Practice Test Guide!