Tiny Tutorial 6: Create Histograms in Python with Matplotlib
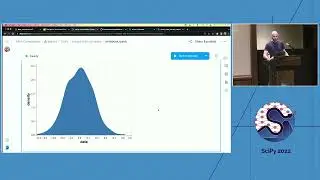
The Matplotlib package for Python provides tons of tools for creating line plots, image plots, and even some 3D plots. Today we are going to create two simple side-by-side histograms.
In this Tiny Tutorial, you will learn how to:
- create a histogram,
- add axis labels
- add a title to the plot
- plot two histograms side-by-side
- adjust bin width
- change the color of the histogram
- add a style to the plot.
This Tiny Tutorial shows just a fraction of Matplotlib's capabilities. There is so much more you can do with this powerful tool! Be sure to press the Subscribe button below if you want to learn more.
**See the the Intro to Plotting Tiny Tutorial here: • Tiny Tutorial 3: Intro to Plotting in...
** View Matplotlib's online documentation here:
https://matplotlib.org
**Learn more about Enthought's Python course offerings here:
https://goo.gl/dnG5Kj
![Vs-Code COMMENTS SHORTCUT ITS VERY EASY[FOR HTML AND CSS]](https://images.videosashka.com/watch/YDUnWgsbwog)


![[НОВИНКА] Doom: The Dark Ages на 5090 (13.05.2025)](https://images.videosashka.com/watch/9GdISCrOtjk)


