MatPlotLib Python Tutorial in Jupyter Notebooks - Part 1
How to create plots in Python (2020). Learn how to get started with Matplotlib. I break down the tutorial into 2 parts; 1) plotting with Numpy 2) Plotting with Pandas. I cover things like; from where to download / create the raw data, how to create different plots (line, bars, subplots, combo, scatter, histogram, etc), how to add titles, legends, labels, tickers, change sizes, change colours and many more!
Support the channel on Patreon:
/ data360yp
Data Analytics Course Link:
http://ipidata.teachable.com/
MatPlotLib Python Tutorial in Jupyter (2020) - Part 1
Tutorial Overview
• What is matplotlib and how/why it's used
Using Numpy
• Line plots using NumPy
• Scatter Plots using NumPy
• Bar plots & Subplots using Numpy
• Histogram using NumPy
Using Pandas
• Line Plots using Pandas
• Combo (Line & Bar) Plots using Pandas df
• Scatterplot Using DFs
• Scatterplots with Legends using Pandas
How to download and install Python through Anaconda:
• How to Download PYTHON for FREE
Data Analytics Course Link: http://ipidata.teachable.com/
Raw Data & Notebook:
https://github.com/Pitsillides91/Pyth...
Yiannis Pitsillides on Social Media:
/ pitsillides91
https://www.instagram.com/ypexists/?h...
https://www.pinterest.co.uk/pitsillid...
/ 1500092413449073
How to create plots in Python (2020) – Part 1
How to create plots in Python (2020)
How to create plots in Python


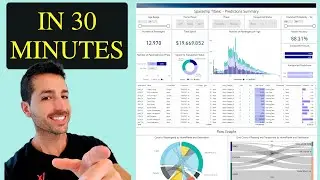
![How to Build Power BI Dashboards from Scratch - Deploying Machine Learning Predictions [2022]](https://images.videosashka.com/watch/Hd_83OykqbY)
![Machine Learning Tutorial for Beginners – Linear Regression Example in Python [Part 1]](https://images.videosashka.com/watch/Q0Q4x58h_BA)

![How to create EXCEL Dashboards - Clean, Automated, Interactive & Nice Design [2022]](https://images.videosashka.com/watch/Hu35gAk_E54)
![Excel Dashboard Design - How to build interactive EXCEL dashboards [2022]](https://images.videosashka.com/watch/Qne0GOxUiJY)

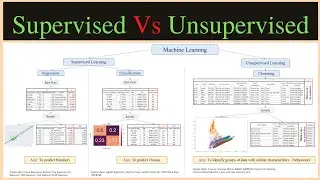
![Regression Vs Classification Vs Clustering Vs Time Series - Examples in Python [2022]](https://images.videosashka.com/watch/LsRhnsmcSJU)