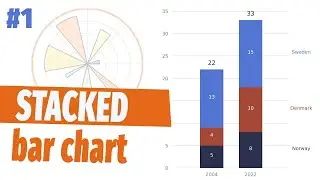
Misleading charts #4: Uneven grouping of data
A very common technique used to mislead is grouping data in uneven periods to fit the story that wants to be told. In today's video, I will show an example of that.
Link to discord:
/ discord
To learn more about Power BI, subscribe to my Power youtube channel here: / @curbalen