2 тысяч подписчиков
144 видео
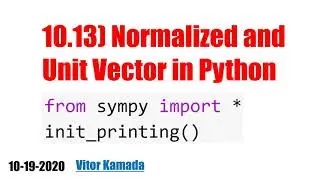
10.13) Normalized and Unit Vector in Python
A6) Tree Diagram: Marginal, Conditional, and Joint Probabilities
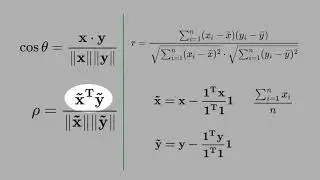
10.15) Correlation as the Cosine of the Angle between Two Vectors
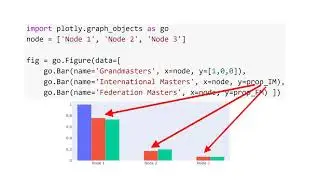
5.3) Plotly: Bar Chart
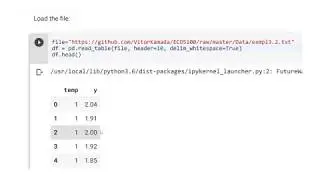
1.7) Upload Data in Github to Open in Google Colab
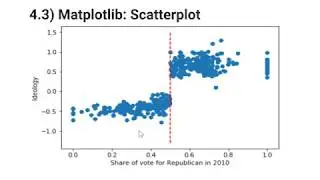
4.3) Matplotlib: Scatterplot
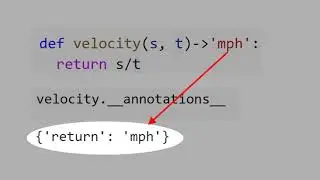
6.7) What the Arrow Means in Python Function Definition?
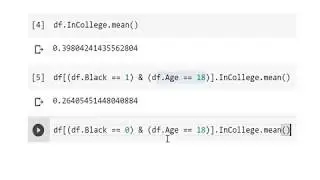
3.8) Pandas: Mean of a Variable with Conditions
J3) Confirmation Bias Test
K4) Introductory Probability Book used in Harvard
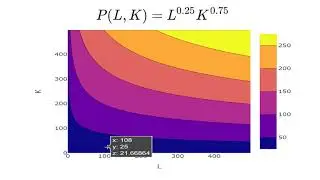
9.20) Plotly: Contour Plot or Level Curves
8.1) DataCamp Signal Assessment: Python Programming
9.13) Calculate Partial Derivatives in Python
J6) Categorical vs Numerical Variable
10.18) Eigenvalue, Trace, and Determinant
1.6) Learn Latex in Google Colab
1.10) How DataCamp works?
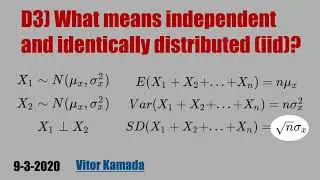
D5) Random Variables: Independent and Identically Distributed (i.i.d.)
1.5) Introduction to Markdown in Google Colab
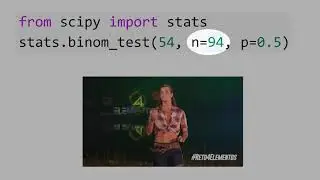
G5) Python: Binomial Test
K1) Book Review: Introductory Statistics with Randomization and Simulation
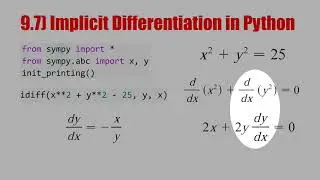
9.7) Implicit Differentiation in Python
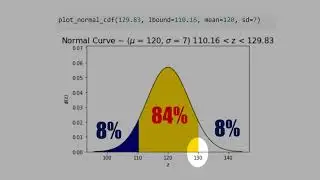
D7) Python: Interval for Normal Distribution
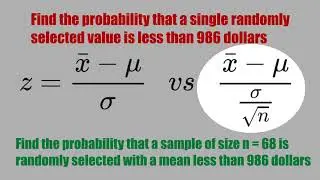
D8) Probability of Normal Distribution with Sample Size
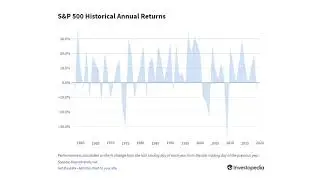
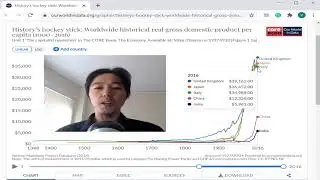
J2) S&P 500: Average Return vs Standard Deviation
L2) How reliable is the BinaxNOW COVID 19 Ag Card test? Sensitivity = 84.6%. Specificity = 98.5%
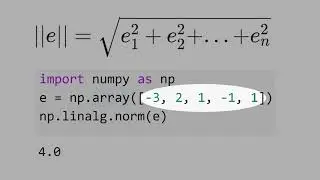
10.2) Euclidean Norm of an n-vector
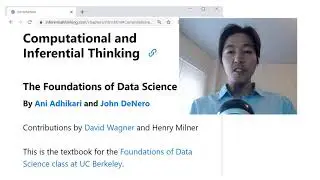
K2) Book Review: Computational and Inferential Thinking
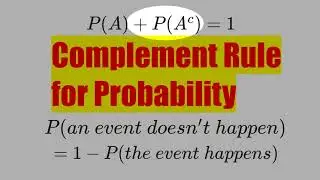
A7) Complement Rule for Probability
K3) How to learn Economics and Statistics at the same time?
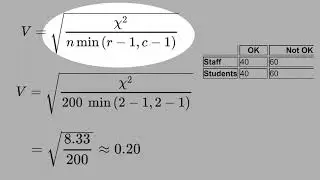
L1) How to Calculate Chi-Squared and Cramer's V
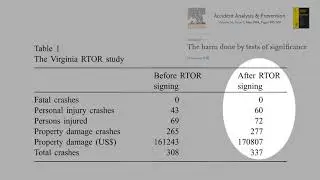
J7) Does Sample Size Matter? Pre-Post Comparison
1.9) Why learn Python?
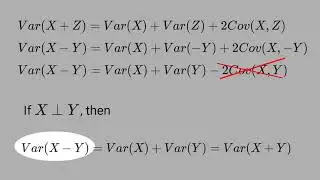
C7) Prove that Var(X-Y)=Var(X)+Var(Y)-2Cov(X,Y)
D3) What means independent and identically distributed (iid)?
3.4) Pandas: Reading CSV or Text Files in Google Colab
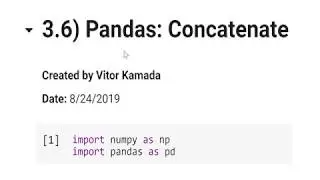
3.6) Pandas: Concatenate or Append Function
9.14) How to Plot a 3D Chart to Find the Minimum Value in Python
6.2) Python: Loop over List, String, Dictionary, and Numpy Array
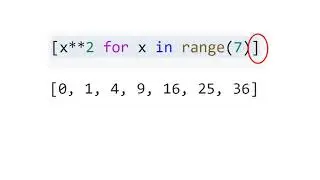
6.5) Python Loop, List Comprehension, and Lambda Function
3.11) Load Excel/CSV Files into Google Colab
5.1) Plotly: Dynamic Scatterplot with Clusters
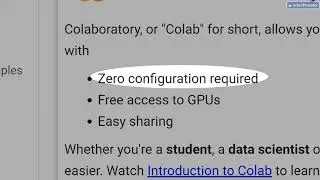
1.2) Why run Python code in Google Colab?
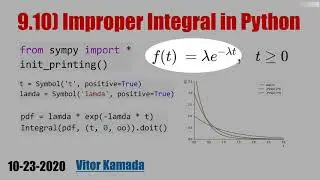
9.10) Improper Integral in Python
9.19) Learn How to Plot a Dynamic 3D Chart in Python
2.1) NumPy: Data Types
10.19) Python: Eigenvalue, Trace, and Determinant
7.1) Everything in Python is an Object
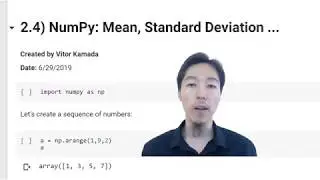
2.4) NumPy: Mean, Standard Deviation
B7) Bernoulli Random Variable