4 тысяч подписчиков
68 видео
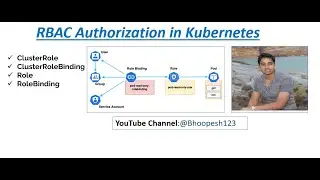
Kubernetes RBAC | Role Based Access Control | ClusterRole, ClusterRoleBinding by Practical Examples
Install Grafana with secure https | Cert Manager + Nginx + TLS + Let'sEncrypt | Secure Grafana TLS
Kubernetes ConfigMap | ConfigMap in Kubernetes | ConfigMap Demo | Configmap vs Secret in Kubernetes
Create your First Azure Pipeline Azure DevOps | Create a CI/CD Pipeline in Azure DevOps |
Grafana Tempo Setup | Grafana Tempo Tutorial | Grafana Tempo Tracing | Distributed Tracing
Kubernetes DaemonSet Explained | Daemonsets Basics | Daemonsets in Kubernetes
Deploy MySQL on Kubernetes | MySQL Exporter | MySQL Monitoring with Prometheus and Grafana
Grafana Setup | Ubuntu | Prometheus Grafana Loki Installation | Grafana setup Ubuntu + Loki + Ubuntu
YAML Parsing | Working with YAML Files | Install YQ | Parse YAML files in YQ | YAML Data with yq
Monitoring Websites with Blackbox Exporter Prometheus | Prometheus Synthetic Monitoring | Helm
Grafana Cognito Authentication | AWS Cognito for Grafana | Grafana Cognito Authentication - Part 2
Kubernetes Ingress Explained for Beginners | Ingress Controller in 10 mins | NGINX Explained
Python-MySQL | Inserting Data into SQL | Inserting Data to MySQL Table through Python Code |
Kubernetes Jobs Explained for Beginners | Kubernetes CronJobs Example | Kubernetes Job Tutorial
Kubernetes Persistent Volume, Persistent Volume Claim | Storage Class | Pod using pvc |
OTEL Collector on Docker | How to Setup OpenTelemetry Collector locally with Docker|
Kubernetes Cluster Monitoring by Grafana Alloy using Helm | How Grafana Alloy Works in Minikube
Microsoft MSSQL Monitoring via Elasticsearch | MetricBeat | Filebeat | Kibana 8.X | Elastic 8.X
Getting Started with Grafana Alloy | How Grafana Alloy Works | Grafana Alloy Loki Logging Tutorial
Install and Configure Grafana Alloy | How Grafana Alloy Works | Grafana Alloy Tutorial Kubernetes
SSL Installation for Elasticsearch & Kibana 8.x | Metric Beat | Elasticsearch | Kibana -- Part 1
Grafana Mimir | Introducing Grafana Mimir | Getting Started with Grafana Mimir | Mimir on Ubuntu
Step by Step Installation of Grafana Alloy Using Helm | How Grafana Alloy Works for Pod Metrics
Getting Started with Grafana Alloy | Grafana Alloy Metrics Logs Tracing Tutorial on Ubuntu
Getting Started with Grafana Alloy | How Grafana Alloy Works | Grafana Alloy Tracing Tutorial
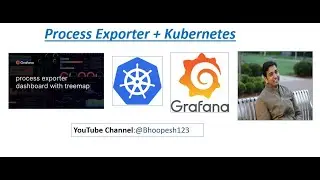
Process Exporter Prometheus | Process Exporter Helm | Process Exporter (Processes Monitoring)
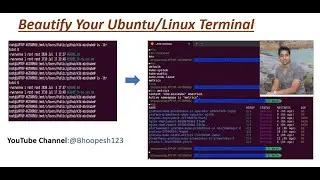
Make Windows Terminal Look Better | Oh my zsh | Add Colors to your Terminal | Kubectx | Kubecolor
EFK Setup in Kubernetes Cluster | Logging in Kubernetes with Elasticsearch Fluentd and Kibana | ELK
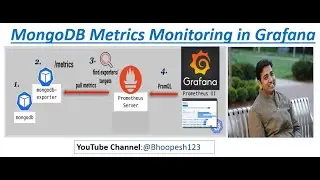
How To Monitor MongoDB with Grafana | Steps to monitor third-party apps using Prometheus Exporter
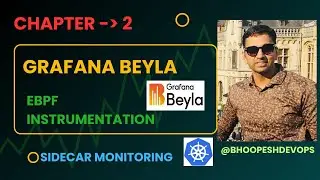
Grafana Beyla Tutorial | How Grafana Beyla Works | eBPF Tool Observability in Kubernetes
Getting started with Grafana Cloud | Grafana Tempo Setup | Grafana Tempo Tutorial on Ubuntu
Kubernetes Basics: Pods Service Deployment | Pod in Kubernetes |
Configure Gmail for Grafana | Use Gmail SMTP Server for Grafana | Email Alerts from Grafana to Gmail
Elasticsearch | Kibana | Set up Fleet Server | Install Elastic Agent 8.x | Fleet Server - Part2
Prometheus x509-certificate-exporter | Certificates Expiration (X509 Certificate Exporter) | Grafana
Grafana Beyla Tutorial | How Grafana Beyla Works using OpenTelemetry Collector
Install Grafana on Ubuntu | Secure Grafana with DNS and Let's Encrypt | Set up Grafana HTTPS
How to install Minikube on windows | How to install docker on Ubuntu | How to install wsl
Deploying PostgreSQL on Kubernetes | Install PostgreSQL on Kubernetes | Grafana PostgreSQL Dashboard
Visualizing JIRA with Grafana | How to Create Jira Ticket from Grafana | Grafana Jira Integration
Create EKS Cluster on AWS using Console | Create Kubernetes Cluster on Amazon EKS | AWS EKS Demo
ELK Stack Tutorial | Log Management | Elasticsearch Logstash Kibana | ELK Setup on Ubuntu | DevOps
Getting Started with Harness Chaos Engineering | Continuous Resilience using Harness Chaos
OpenTelemetry Log Collector on Docker | How to Setup OTEL Logging locally with Docker | Loki Logs
Grafana Alerts Tutorial | How to create Alert in Grafana | Alerting in Grafana |
Grafana Loki Tutorial | Grafana Loki Promtail | Log Aggregation and Visualization |
How Grafana Alloy Works | Grafana Alloy Tutorial | Grafana Alloy Logging on Kubernetes
OpenTelemetry Logs Collector on Ubuntu | How to Setup OpenTelemetry Collector on Ubuntu
Elasticsearch Alerting Tutorial | Email via Logstash Plugin | Kibana Alerting Tutorial on Ubuntu
Getting Started with Grafana Alloy | How Grafana Alloy Works | Grafana Alloy Tutorial